
EPI Intelligence Products

Sample Reports

Illustrative examples of EPI's intelligence products. Each sample shows the structure, depth and analytical approach of the live service — including the actual charts and analysis EPI produces.

Illustrative samples only. Not investment or procurement advice.
EPI Studio™ — Daily Intelligence
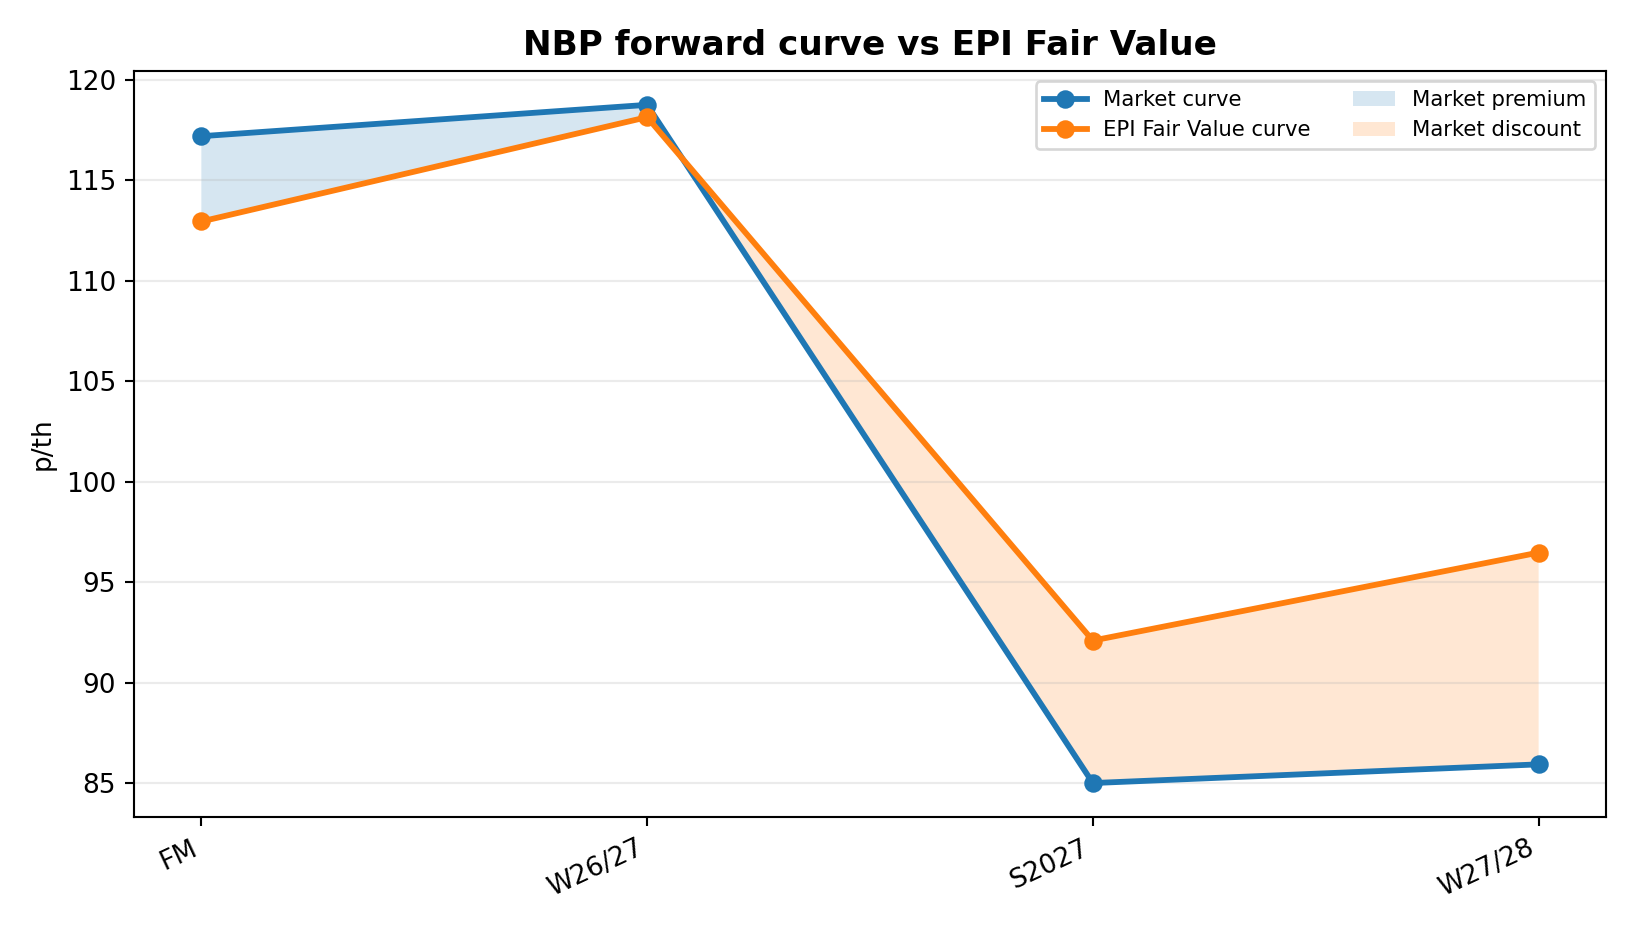
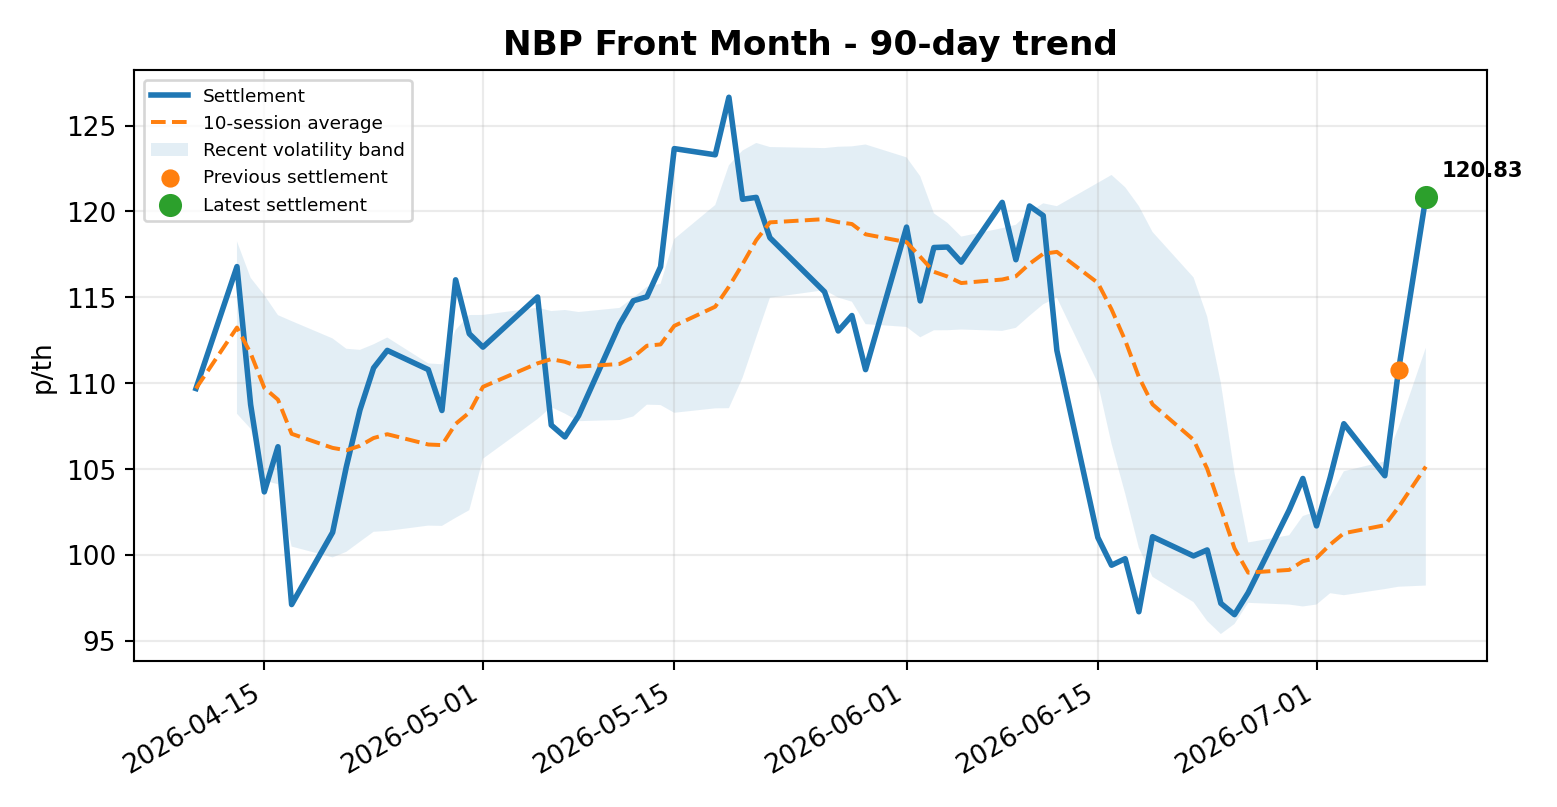
NBP price chart from EPI daily market report
ILLUSTRATIVE SAMPLE
Daily Intelligence

Daily Client Market Report

A concise daily briefing covering overnight and morning market movements in UK gas and power, key drivers, procurement implications and client-ready talking points. Configured per client for broker, supplier and buyer distribution.

Audience
Energy buyers, account managers, commercial clients
Delivery
Every trading day
Request a Demonstration
EPI Studio™ — Forward Curve Analysis
EPI forward curve fair value analysis
ILLUSTRATIVE SAMPLE
Forward Curve Analysis

Strategic Curve and Fair Value Review

EPI's independent fair value assessment for UK gas and power forward curves. Includes driver attribution, confidence scoring, range analysis and procurement strategy implications for each seasonal contract.

Audience
Energy buyers, procurement teams, risk managers
Delivery
Weekly or on-demand
Request a Demonstration
EPI Studio™ — Power Market Intelligence
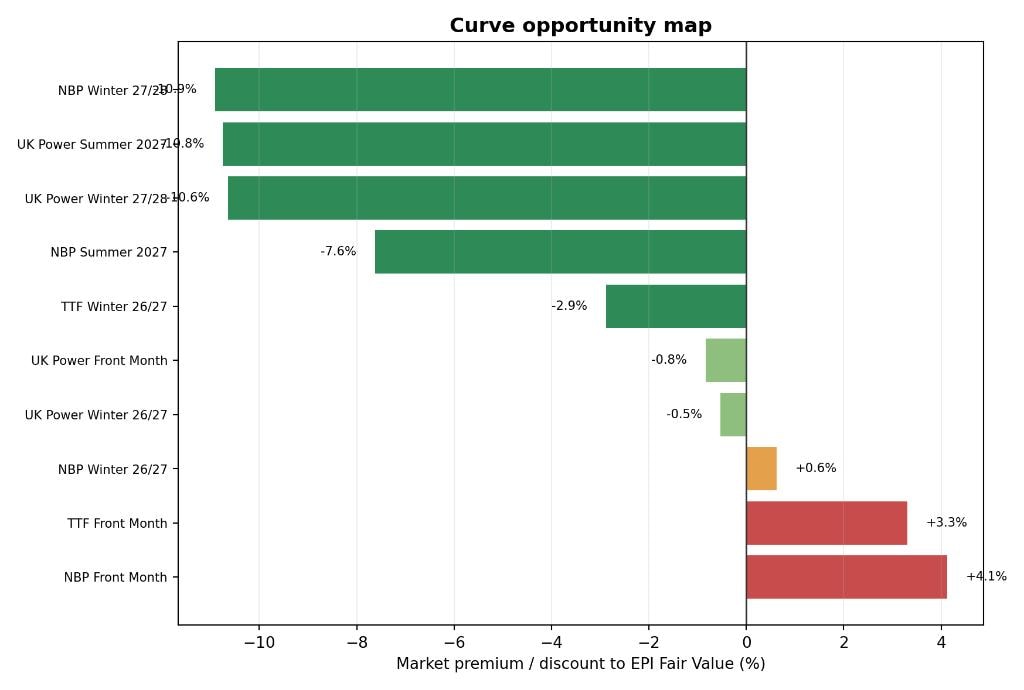
EPI procurement opportunity map for power market
ILLUSTRATIVE SAMPLE
Power Market Intelligence

Near-Term Power Intelligence

Detailed analysis of GB power market conditions for the coming 7–14 days. Covers generation mix, wind and solar forecasts, demand outlook, system tightness signals and day-ahead price drivers.

Audience
Generators, suppliers, traders, system operators
Delivery
Twice weekly
Request a Demonstration
EPI Studio™ — Ofgem Price Cap
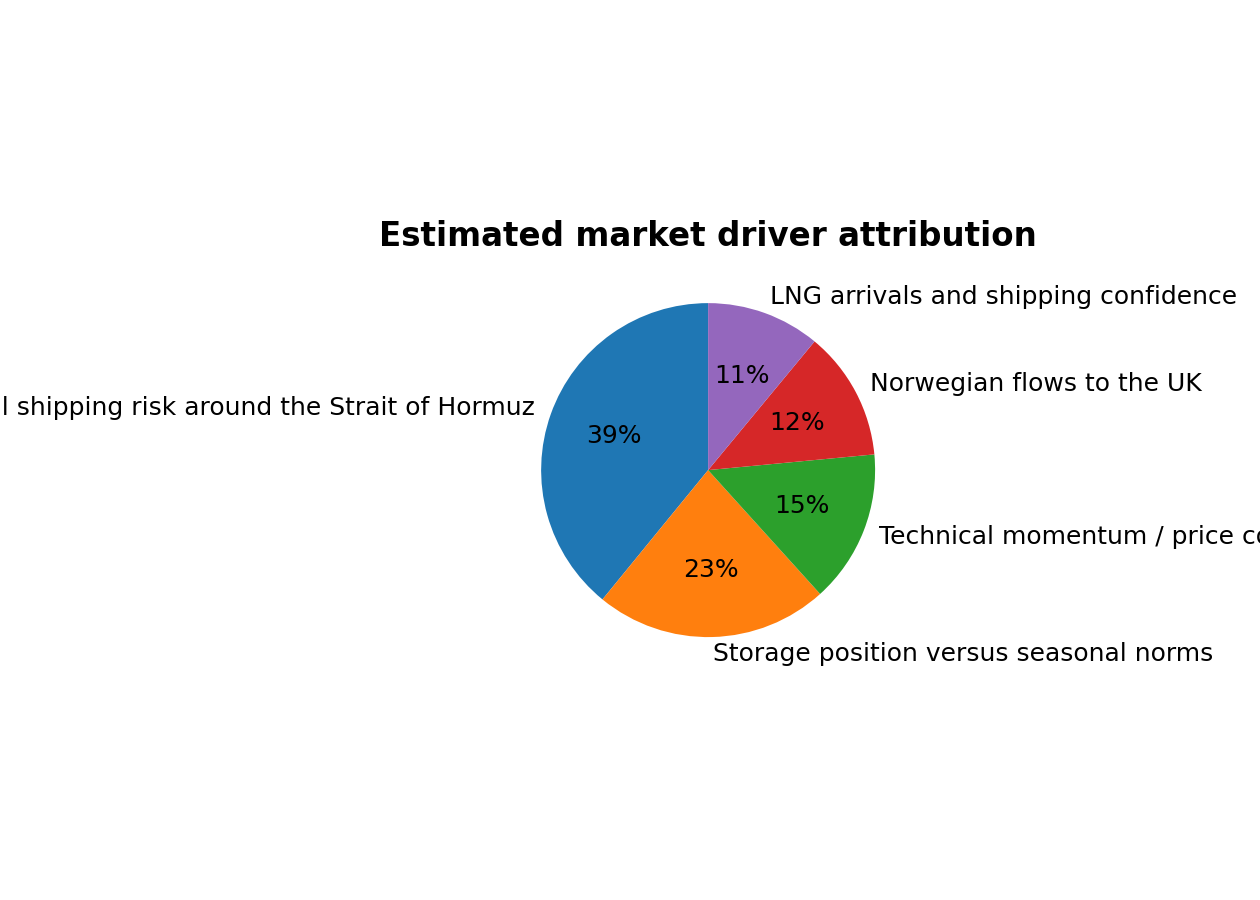
EPI driver attribution chart used in price cap analysis
ILLUSTRATIVE SAMPLE
Ofgem Price Cap

Price Cap Forecast and Audit Trail

EPI's independent Ofgem Price Cap forecast with full methodology, component-level breakdown, audit trail and confidence assessment. Includes unit rates, standing charges and TDCV-adjusted comparisons.

Audience
Consumer organisations, journalists, energy professionals
Delivery
Updated each weekday during observation windows
Request a Demonstration
EPI Studio™ — Technical Analysis
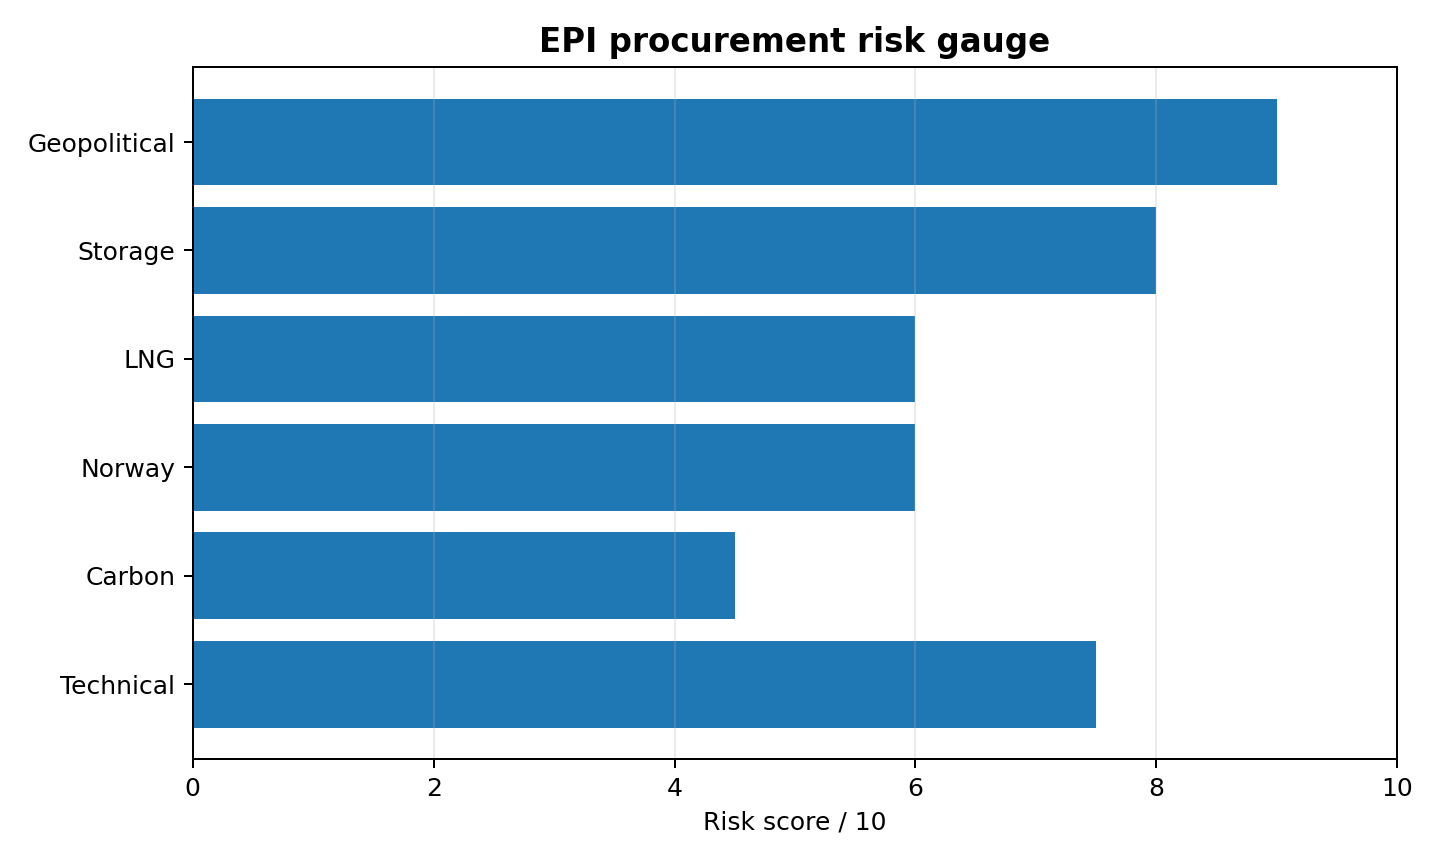
EPI risk dashboard used in technical analysis report
ILLUSTRATIVE SAMPLE — PRIVATE ACCESS
Technical Analysis

Technical Market Intelligence

Quantitative technical analysis of UK gas and power forward curves. Covers support and resistance levels, momentum indicators, regime signals and short-term price targets for active procurement and trading decisions.

Audience
Traders, investors, active procurement teams
Delivery
Weekly
Request a Demonstration
EPI Studio™ — European Gas Markets
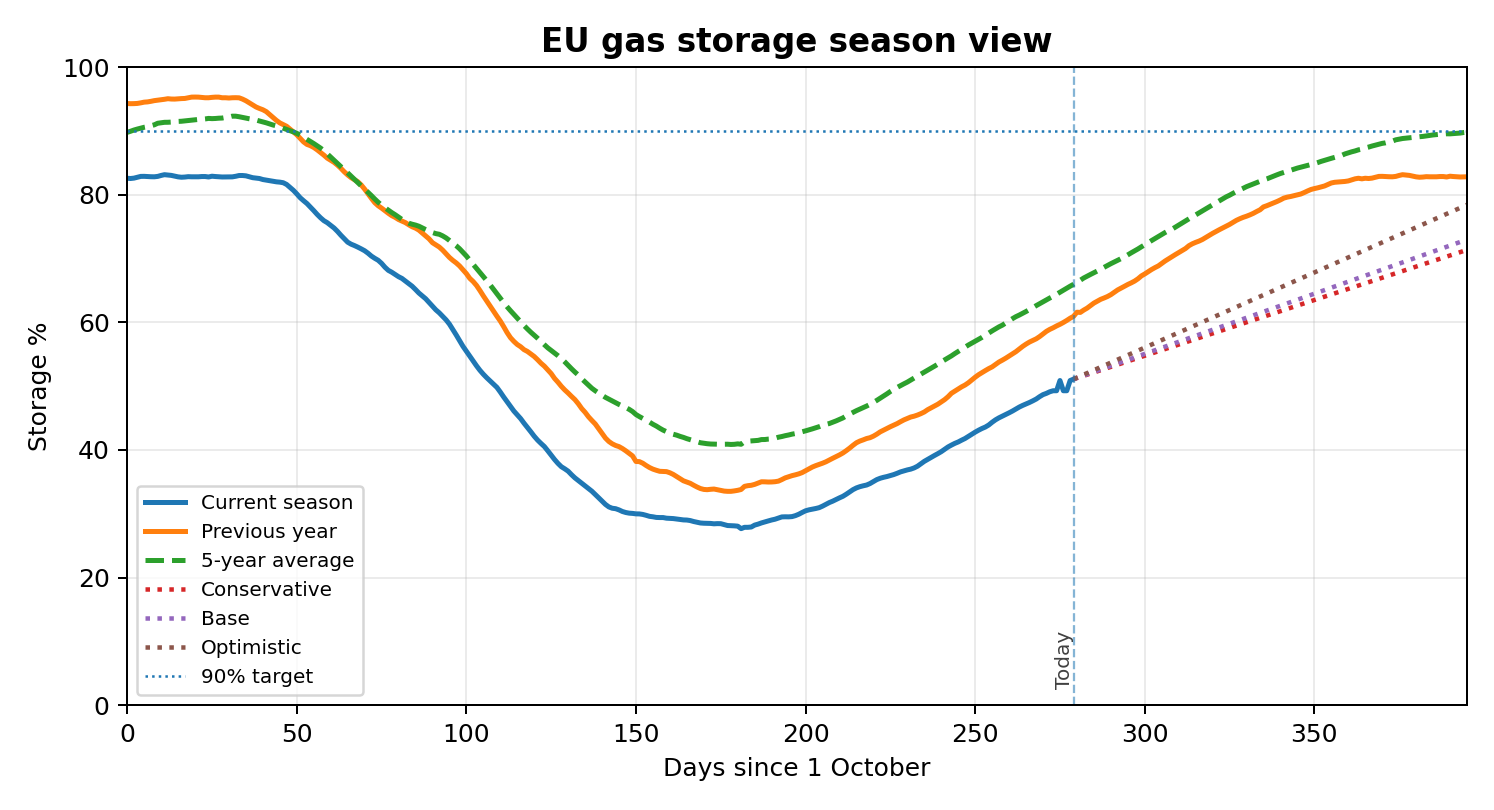
EU gas storage season chart from EPI European gas risk review
ILLUSTRATIVE SAMPLE
European Gas Markets

Storage and European Gas Risk Review

Analysis of European gas storage trajectories, LNG flows, Norwegian supply, TTF forward curve and seasonal risk outlook. Includes EPI’s end-of-season storage forecast and implications for UK winter gas prices.

Audience
Gas buyers, suppliers, traders, risk managers
Delivery
Weekly
Request a Demonstration

All samples on this page are illustrative only. They are provided to demonstrate the structure and analytical approach of EPI's intelligence products. They do not constitute investment advice, procurement advice or a recommendation to buy or sell any energy contract. Live reports are configured per client and may differ materially from these examples.