

Energy Price Intelligence
Client access

Intelligence built for energy professionals

EPI clients receive a suite of analytical tools, daily market intelligence and bespoke reporting — all grounded in transparent methodology and delivered through a secure client area.

Sample intelligence

Illustrative examples of the intelligence EPI clients receive. Values are delayed, anonymised or representative.

EPI Fair Value™ — NBP front monthDiscount
Market price
97.4 p/th
EPI Fair Value
88.1 p/th
Market trading at a +10.6% premium to fundamental fair value. Signals caution for near-term buyers.
Illustrative — values delayed and anonymised
Technical direction — NBP seasonal
TrendBearish
MomentumWeakening
Key support82.0 p/th
Key resistance101.5 p/th
Illustrative — representative values only
Near-term UK baseload — day-ahead
£84.20
/MWh forecast
Low
£79.50
Central
£84.20
High
£91.80
Confidence: 72% — wind generation within normal range; demand slightly elevated.
Illustrative — values delayed and anonymised
Forecast accuracy — 30-day rolling
74%
Directional accuracy
74% of day-ahead directional calls correct over the trailing 30 days.
Mean error
±£3.40
Calls made
30
Illustrative — representative of live model performance
Composite market-risk score
6.2
Elevated
Score of 6.2 / 10. Geopolitical and storage risk factors are the primary drivers.
Supply risk65%
Demand risk38%
Geopolitical risk72%
Storage risk55%
Illustrative — representative composite score
European gas storage — seasonal risk
71.4%
full — below 5yr avg
Current fill71.4%
0%5yr avg: 79%100%
Storage deficit of 7.6 percentage points vs seasonal average. Elevated upside price risk into winter.
Illustrative — values delayed and anonymised
Procurement signal — anonymised example
Buy signal — moderate confidenceQ2 2025
Client A (industrial buyer, 8 GWh/yr) entered a 12-month fixed contract at 94.2 p/th following an EPI buy signal. Market subsequently moved to 108 p/th within 6 weeks.
Entry price
94.2 p/th
6-wk market
108.0 p/th
Anonymised and illustrative — not a guarantee of future results
Ofgem price-cap forecastEPI model
Q3 2025£1,568Confirmed
Q4 2025£1,710Forecast
Q1 2026£1,820Indicative
Q2 2026£1,640Indicative
Illustrative — see public tool for current EPI forecast
Technical analysis

Market structure at a glance

EPI technical analysis tracks price structure, momentum and key levels across gas and power contracts. The example below uses illustrative, delayed values.

View full technical-analysis suite
Broad market stance
Bearish
Confidence
68%
TrendBearish
MomentumWeakening
StructureLower highs / lower lows
VolatilityModerate
The overall structure favours sellers. Price is printing lower highs and lower lows on the weekly chart. Momentum is fading but not yet oversold.
Illustrative — representative values only
NBP front month — 90-day price path
97.4p/th▼ 8.3% (90d)
Resistance 106.0Support 82.0
Support
82.0 p/th
Current
97.4 p/th
Resistance
106.0 p/th
Illustrative — values delayed and anonymised
Key concepts — plain English
Momentum
How much energy is behind the current price move. Strong momentum means the trend is likely to continue; fading momentum is an early warning that a reversal may be near.
🟢
Support
A price level where buyers have historically stepped in and halted a decline. Think of it as a floor — the market has bounced here before.
🔴
Resistance
A price level where sellers have historically emerged and capped a rally. Think of it as a ceiling — the market has struggled to break above this level.
🎯
Target
The price level EPI expects the market to reach if the current move continues. Targets are derived from measured moves, prior structure and momentum projections.
Example target progression — NBP seasonal
When a key support level breaks, EPI projects a sequence of downside targets based on measured moves and prior structure. This is an anonymised example.
1
Entry signal106.5 p/th
Break below prior supportTriggered
2
Target 197.0 p/th
Measured move — 61.8% projectionReached
3
Target 288.5 p/th
Prior swing low / structureActive
4
Target 382.0 p/th
Full measured move projectionPending
Target 2 (88.5 p/th) is the current active objective. A daily close below 88.5 would open Target 3 at 82.0 p/th.
Anonymised and illustrative — not a guarantee of future price action
View the full technical-analysis suite with client access.
Full contract selector, historical signal feed, Fibonacci levels, Ichimoku structure and probability paths — available to EPI clients.
Request a demonstration
Near-term power forecast

GB baseload — day-ahead and intraday

EPI publishes a rolling near-term GB power forecast covering day-ahead through to 14-day horizon. Generators, flexible assets and large consumers use it to time dispatch decisions and procurement windows.

Create client account
GB baseload — day-ahead
£84.20/MWh
Confidence
72%
Delivery date
Tuesday 25 Aug 2026
Published
18:30 day prior
P10 low
£76.50
Central
£84.20
P90 high
£93.80
Key drivers
Wind generation
8.4 GWBelow seasonal avg
Solar output
3.1 GWModerate
Demand
34.2 GWSlightly elevated
Interconnector
Import2.8 GW net
Illustrative — values delayed and anonymised
Hourly forecast — example settlement periods
The full feed covers all 48 half-hour settlement periods. This shows a representative sample of six periods across the day.
SP 01 00:00£68.4/MWh
SP 13 06:00£74.2/MWh
SP 25 12:00£84.2/MWh
SP 31 15:00£91.6/MWh
SP 37 18:00£97.8/MWh
SP 43 21:00£79.5/MWh
Evening peak — SP 37 (18:00)
Low wind and elevated demand combine to push the 18:00 period to the day's forecast high of £97.8/MWh. Flexible assets should plan for peak dispatch in this window.
Illustrative — full 48-period feed available with client access
Forecast accuracy — 30-day rolling
EPI tracks every published forecast against outturn. The figures below are a representative sample of model performance.
Day-ahead MAE
£3.40
mean abs. error
Directional
74%
correct direction
Accuracy by horizon
Day-ahead (D+1)
MAE £3.4074%
Two-day (D+2)
MAE £5.1069%
Three-day (D+3)
MAE £7.8063%
7-day (D+7)
MAE £12.4058%
Representative of live model performance — not a guarantee of future accuracy
Who uses this forecast
Generators and flexible assets
A near-term price forecast is most valuable when it informs a decision that can still be acted on. EPI publishes the forecast the evening before delivery so operators have time to adjust dispatch plans, hedge intraday exposure or hold back flexible capacity for the peak window.
Dispatch optimisation
Identify the highest-value settlement periods and plan flexible generation or battery dispatch around the forecast peak.
Intraday hedging
Use the half-hourly profile to decide whether to lock in day-ahead prices or hold exposure for intraday markets.
Procurement timing
Large consumers and industrial buyers use the 7-day horizon to time fixed-price purchases around forecast price troughs.
Risk flagging
When confidence falls below threshold, the forecast flags the reason — wind uncertainty, demand surprise or interconnector constraint — so operators can widen their contingency.
View the full near-term power forecast with client access.
Full 48-period hourly feed, 14-day forward horizon, forecast archive, calibration values and P10–P90 probability paths — available to EPI clients.
Request a demonstration
Procurement intelligence

Entry signals and forward layering

EPI procurement intelligence combines fair-value analysis, technical structure and forward-curve shape to identify when market prices represent genuine value — and when they do not.
Request a demonstration
Market price vs EPI Fair Value™
EPI Fair Value™ is a model-derived estimate of where the market should be trading given current fundamentals. When market price diverges materially from fair value, it generates a procurement signal.
Market price
£97.40
NBP Cal-27 · p/th
EPI Fair Value™
£88.60
model estimate
Divergence from fair value+9.9% above
UndervaluedFair valueOvervalued
Signal: hold — market trading above fair value
At current levels the market is pricing in a risk premium not supported by the fundamental model. EPI signals a hold on new forward purchases until the gap narrows.
Illustrative — values anonymised and delayed
Prompt vs forward — example decision
One of the most common procurement decisions is whether to buy prompt or lock in a forward price. EPI frames this as a structured comparison, not a guess.
Prompt (day-ahead)
£84.20/MWh
Forecast central case for tomorrow
Favoured
Near-term forecast is below the forward curve. Buying prompt captures the discount while the fundamental picture remains soft.
Cal-27 forward
£97.40/MWh
Current exchange mid-price
Hold
Forward is trading 9.9% above EPI Fair Value™. Locking in at this level would crystallise an above-fair-value cost.
Illustrative — not a recommendation; client-specific positions not shown
What is selective forward layering?
Buy in tranches, only when value is present
Rather than fixing 100% of a forward requirement at a single point in time — which concentrates all price risk on one decision — selective layering splits the purchase into tranches and only executes each tranche when the market offers genuine value relative to EPI Fair Value™.
How it works
1
Set a target volume and horizon
Define how much forward cover is needed and over what period — e.g. 60% of Cal-27 requirement by end of Q3.
2
Monitor fair-value divergence
EPI tracks the gap between market price and Fair Value™ daily. When the market dips to or below fair value, a buy signal is issued.
3
Execute a tranche on signal
A defined tranche — typically 10–20% of the total requirement — is purchased at the signal price, locking in value without over-committing.
4
Repeat until target cover is reached
The process repeats across the horizon. The blended entry price reflects multiple favourable windows rather than a single arbitrary date.
The outcome
Clients who follow a layered strategy typically achieve a blended entry price closer to fair value than those who fix at a single point. The approach also reduces the psychological pressure of trying to time the market perfectly.
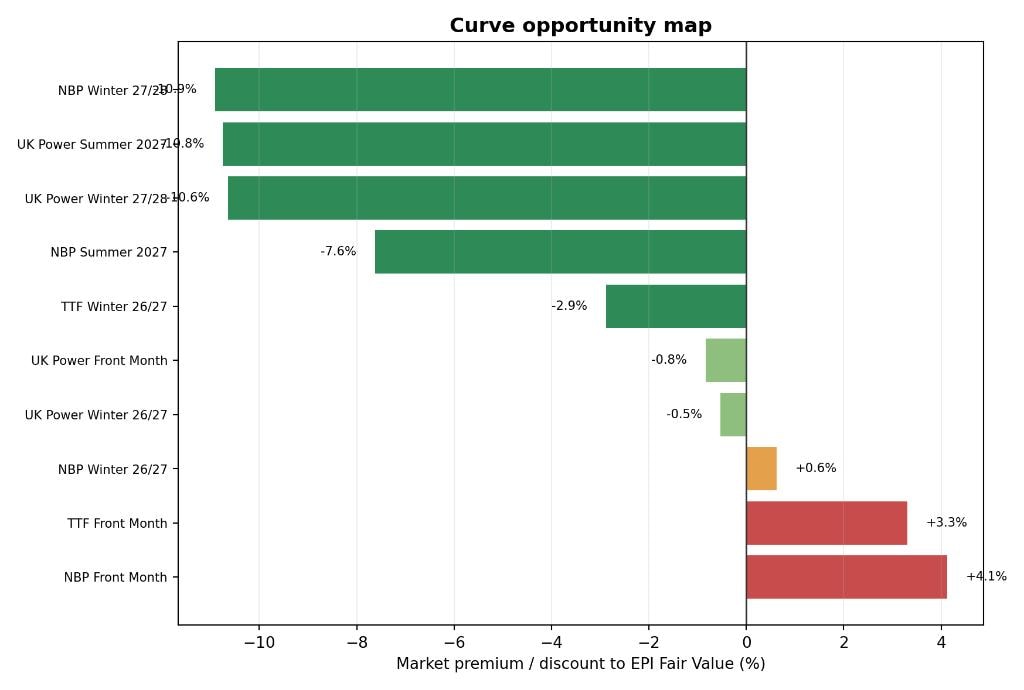
EPI procurement opportunity map — illustrative sample
Sample report — illustrative
Procurement opportunity map
Forward curve vs fair value — visual overlay
The procurement opportunity map plots the forward curve alongside EPI Fair Value™ across all tenors. Shaded regions indicate where the market is trading above or below fair value, making entry windows immediately visible.
Forward curve vs Fair Value™ overlay
Divergence magnitude by tenor
Signal status per contract
Recommended layering windows
Illustrative sample — live client reports contain current data and are not publicly available
See how EPI procurement intelligence applies to your forward book.
Live entry signals, client-specific layering schedules, collateral modelling and private report archives are available to EPI clients only.
Request a demonstration
Market outlook and risk

Composite risk band and trend overlay

EPI's market risk score aggregates supply, demand, geopolitical and technical signals into a single composite band. It is an analytical overlay that describes the current risk environment — it is not a price forecast.

Create client account
Composite risk band
Elevated
Score 62 / 100 — updated weekly
62
Low
0–25
Moderate
26–50
Elevated
51–75
High
76–100
Current trend
Risk has edged higher over the past two weeks, driven by tightening European storage injections and renewed uncertainty around Hormuz shipping lanes. The composite score has risen from 54 to 62 since the previous weekly update.
Illustrative — delayed and anonymised. This score is an analytical overlay, not a price forecast.
Leading risk drivers
The two drivers currently contributing most to the composite score. Full driver attribution — across supply, demand, geopolitical and technical sub-scores — is available with client access.
01European storage injection shortfall
+11 ptsSupply
Seasonal injection rates are running 8% below the five-year average. If the shortfall persists into September, winter storage cover will enter the heating season below the 90% threshold that historically anchors prompt prices.
02Hormuz shipping uncertainty
+7 ptsGeopolitical
Elevated transit risk on the Strait of Hormuz is adding a geopolitical premium to LNG spot prices. EPI monitors shipping data daily; any escalation would push this driver to the top position.
Illustrative — full driver attribution not shown publicly
What the risk score is — and is not
An analytical overlay, not a price forecast
What it measures
The composite risk score measures the breadth and intensity of risk factors currently active in the market — storage levels, supply disruption probability, demand volatility, geopolitical tension and technical structure.
What it does not do
The score does not predict where prices will go. A high risk score means the environment is uncertain and volatile; it does not mean prices will rise. Prices can fall sharply in a high-risk environment if a risk factor resolves.
How clients use it
Clients use the risk band to calibrate their hedging posture — widening contingency buffers when the score is elevated, and tightening them when risk normalises. It is one input among several, not a standalone trading signal.
Full driver attribution, sub-score history and the weekly risk narrative are available to EPI clients. Create client account →
Ofgem price-cap intelligence

Quarterly cap forecast — unit-rate ranges

EPI publishes a quarterly Ofgem price-cap forecast covering the active period and the next two quarters. The forecast is built from wholesale forward curves, network charge projections and Ofgem's published methodology.

Request detailed access
High-level forecast
£1,720/yr typical
Dual-fuel, typical household
Confidence
High
Active forecast period
Q3 2026 — Jul to Sep
Next review
Ofgem — Oct 2026
Unit-rate ranges — Q3 2026
Electricity — unit rate/kWh
Low
24.5p
Central
25.0p
High
25.8p
Electricity — standing charge/day
Low
53p
Central
55p
High
58p
Gas — unit rate/kWh
Low
6.2p
Central
6.4p
High
6.7p
Gas — standing charge/day
Low
29p
Central
31p
High
33p
Illustrative — values delayed and anonymised
How the forecast is built
Wholesale curves, network charges and Ofgem methodology
Ofgem sets the price cap quarterly using a formula that combines wholesale energy costs, network charges, operating costs and a supplier margin allowance. EPI models each component separately and aggregates them to produce a unit-rate forecast.
1
Wholesale energy cost
The largest component. EPI uses NBP and power forward curves to project the wholesale cost allowance Ofgem will set for the quarter.
2
Network and policy charges
Transmission, distribution and policy levies (e.g. RO, FiT, CfD) are modelled from published regulatory determinations and updated when new data is released.
3
Operating cost and margin
Ofgem publishes allowed operating cost and margin assumptions. EPI tracks these and adjusts the model when Ofgem consults on methodology changes.
4
Scenario range
Low, central and high scenarios reflect P10–P90 uncertainty in the wholesale component. Network and policy charges are treated as near-certain within the quarter.
Private calculation bridges, regional outputs, full quarterly histories and downloadable model files are available to EPI clients only. Request detailed access →
Confidence by quarter
Confidence is highest for the active quarter — where Ofgem has already set most components — and declines as the wholesale uncertainty window widens.
Q3 2026 (active)High
Cap already set; wholesale locked
Q4 2026Moderate
Wholesale window open; network near-certain
Q1 2027Low
Wide wholesale uncertainty; early estimate
Full Ofgem price-cap analysis
Private calculation bridges, regional breakdowns, full quarterly history and downloadable model files are available with client access.
Request detailed access

9 intelligence products — all included with client access

Daily Market Intelligence

Available with client access

A structured daily briefing covering the key drivers moving UK and European energy markets. Each report includes driver attribution, confidence scoring, and a plain-English assessment of what the market is doing and why — without the noise.

Typical daily coverageNBP, power, carbon, LNG, storage, macro

EPI Fair Value™

Available with client access

An independent fair-value curve built from first principles — not consensus. EPI Fair Value identifies where the forward curve is trading at a premium or discount to fundamental value, giving procurement teams and traders a structured basis for timing decisions.

Model inputsWholesale, storage, LNG, carbon, macro

Technical Analysis

Available with client access

Systematic technical analysis of NBP front-month and seasonal contracts, including trend identification, support and resistance levels, Fibonacci retracement zones, and momentum signals. Updated daily alongside the fundamental view.

Contracts coveredNBP front-month, seasonal, power

Near-Term Power Forecast

Available with client access

A 14-day forward power generation forecast covering wind, solar, demand, and residual load — with confidence-adjusted outputs and data-age indicators. Designed for procurement teams and traders who need to understand the near-term supply-demand balance.

Forecast horizon14-day forward, updated daily

Procurement Entry Signals

Available with client access

Structured buy and hold signals for energy procurement, derived from EPI Fair Value, technical analysis, and market regime assessment. Each signal includes a confidence level, supporting rationale, and suggested action — giving procurement teams a clear framework for timing decisions.

Signal typesBuy, hold, wait — with confidence scoring

Market Outlook and Risk

Available with client access

A structured assessment of the current market regime, key risk factors, and the balance of upside and downside scenarios. Updated as conditions change, with a clear view of what could move prices materially in either direction.

Regime categoriesBullish, bearish, neutral, cautious

Ofgem Price-Cap Intelligence

Available with client access

The full EPI price-cap model — detailed cost component breakdown, settlement crystallisation tracking, Annex 2 wholesale audit, quarterly forecast history, and bill trajectory analysis. Updated daily during active observation windows.

Quarters modelledCurrent cap + 3 forward quarters

Irish Market Intelligence

Available with client access

Dedicated intelligence for the Irish single electricity market and gas market — covering SEM pricing dynamics, I-SEM capacity market developments, and cross-border flow analysis. Structured for energy buyers and consultants operating across GB and Ireland.

Markets coveredI-SEM, Irish gas, cross-border flows

Bespoke Client Reporting

Available with client access

Custom analytical reports built to your brief — portfolio exposure analysis, contract review, market entry assessments, or regulatory impact studies. Delivered as branded PDF reports or structured data, with full methodology documentation.

Typical turnaround2–5 business days depending on scope

Ready to see EPI in action?

Create your client account to get started, or request a demonstration and we will walk you through the products relevant to your role and market exposure.

All EPI intelligence products are for analytical purposes only. Nothing on this page constitutes financial or procurement advice. Access is subject to client agreement.